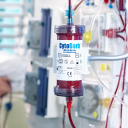
Cytosorbents Corporation (CTSO)
Largest Insider Buys in Sector
CTSO Stock Price History Chart
CTSO Stock Performance
About Cytosorbents Corporation
Cytosorbents Corporation engages in the research, development, and commercialization of medical devices with its blood purification technology platform incorporating a proprietary adsorbent and porous polymer technology. Its flagship product is CytoSorb, an extracorporeal cytokine filter for adjunctive therapy in the treatment of sepsis, adjunctive therapy in other critical care applications, prevention and treatment of perioperative complications of cardiopulmonary bypass surgery, and maintaining or enhancing the quality of solid organs …
Insider Activity of Cytosorbents Corporation
Over the last 12 months, insiders at Cytosorbents Corporation have bought $47,269 and sold $0 worth of Cytosorbents Corporation stock.
On average, over the past 5 years, insiders at Cytosorbents Corporation have bought $164,018 and sold $114,827 worth of stock each year.
Highest buying activity among insiders over the last 12 months: MARIANI PETER J (Chief Financial Officer) — $94,538.
The last purchase of 20,000 shares for transaction amount of $19,294 was made by MARIANI PETER J (Chief Financial Officer) on 2024‑12‑13.
List of Insider Buy and Sell Transactions, Cytosorbents Corporation
| 2024-12-13 | Chief Financial Officer | 20,000 0.0335% | $0.96 | $19,294 | -13.46% | |||
| 2024-12-12 | Chief Financial Officer | 20,000 0.0369% | $0.89 | $17,872 | +2.10% | |||
| 2024-12-11 | Chief Financial Officer | 11,363 0.0201% | $0.89 | $10,103 | +2.23% | |||
| 2023-12-13 | Chief Executive Officer | 75,188 0.129% | $1.33 | $100,000 | -43.34% | |||
| 2023-12-13 | President & COO | 18,797 0.0322% | $1.33 | $25,000 | -43.34% | |||
| 2023-12-13 | Chief Financial Officer | 37,594 0.0645% | $1.33 | $50,000 | -43.34% | |||
| 2023-12-13 | Chief Medical Officer | 22,557 0.0387% | $1.33 | $30,001 | -43.34% | |||
| 2023-12-13 | director | 37,594 0.0645% | $1.33 | $50,000 | -43.34% | |||
| 2023-12-13 | director | 22,557 0.0387% | $1.33 | $30,001 | -43.34% | |||
| 2023-12-13 | director | 7,519 0.0129% | $1.33 | $10,000 | -43.34% | |||
| 2023-12-13 | director | 7,519 0.0129% | $1.33 | $10,000 | -43.34% | |||
| 2023-08-07 | director | 2,000 0.0046% | $3.17 | $6,350 | -67.31% | |||
| 2023-08-04 | director | 1,000 0.0023% | $3.23 | $3,230 | -68.13% | |||
| 2023-05-25 | Interim CFO | 3,300 0.0076% | $2.85 | $9,389 | -51.31% | |||
| 2023-05-10 | Interim CFO | 10,000 0.0212% | $3.11 | $31,058 | -54.17% | |||
| 2022-12-08 | Chief Executive Officer | 5,859 0.0136% | $1.26 | $7,382 | +121.60% | |||
| 2022-12-07 | Chief Executive Officer | 9,850 0.0221% | $1.26 | $12,411 | +114.73% | |||
| 2022-12-06 | Chief Executive Officer | 14,291 0.0324% | $1.26 | $18,064 | +116.41% | |||
| 2022-08-25 | 1,000 0.0021% | $1.91 | $1,910 | +33.82% | ||||
| 2022-06-21 | President and COO | 2,000 0.0047% | $1.80 | $3,600 | +22.73% |
Insider Historical Profitability
| MARIANI PETER J | Chief Financial Officer | 401363 0.732% | $0.89 | 3 | 0 | |
| Chan Phillip P. | Chief Executive Officer | 1068704 1.9491% | $0.89 | 15 | 4 | +34.83% |
| Capponi Vincent | President & COO | 584134 1.0654% | $0.89 | 5 | 16 | +26.1% |
| BLOCH KATHLEEN P. | Chief Financial Officer | 467941 0.8534% | $0.89 | 15 | 11 | +6.75% |
| Deliargyris Efthymios | Chief Medical Officer | 348433 0.6355% | $0.89 | 1 | 0 |
Institutional Investor Ownership
| Avenir Corp | $3.01M | 5.84 | 3.17M | +3.98% | +$115,229.29 | 0.26 | |
| Granahan Investment Management | $2.89M | 5.61 | 3.04M | -15.85% | -$544,644.43 | 0.1 | |
| Skylands Capital LLC | $2.73M | 5.3 | 2.88M | -11.64% | -$359,727.90 | 0.38 | |
| The Vanguard Group | $1.85M | 3.59 | 1.95M | 0% | +$0 | <0.0001 | |
| Neuberger Berman | $1.81M | 3.52 | 1.91M | +6.15% | +$104,971.70 | <0.01 |